Here is the soil and air temperature data for Hudson. This is showing us that air temp is slowly increases throughout the day, and especially between 5-7pm (temperatures reach above 43 degrees). A possible explanation would be that the sun slowly heats the air throughout the day, so when 5-7 pm comes along, the sun is beating down on an area where direct sunlight was (noon-2pm) and making it even warmer. As the sun begins to go down, the heat begins to go away (around 8-9pm) and the warm air begins to cool. Also, air and soil temps stay relatively similar throughout the day; however, soil temps are less likely to have large temperature changes. Soil temps range from 34.8-39.2, whereas the air temperature ranges from 31.6-44.9. Since the range differences are fairly large, it can be concluded that soil is more insolated therefore it withholds more solar radiation than the air when there is outgoing solar radiation. Summarizing, soil holds more heat than air, meaning it takes soil longer to cool off. However, this all depends on whether or not there is a body of water, large mountains/mountain ranges, type of soil, or other such geographic may influence the temperature. For instance, sand is a big insulator of heat, which is why beach sand is so hot during the day because it holds in all that heat. These differences vary by season depending on the location. It depends on each location’s seasonal attributes.Finally, when pertaining to agriculture, soil temperature is important because if the soil is too hot it will soak up all the moisture, whereas if it is too cold it will spoil the crops by freezing the roots and they cannot soak up moisture.

The following information was taken by 3 cities in Michigan. For the most part, temperatures are gradually increasing through 18 hours and then begin to dip back down. This may be because of the sunlight throughout the day and the temperature begins to cool down when the sun sets. The temp data definitely changes more because soil takes longer to heat up and cool down than air and soil may still be insulated by snow in some locations. Air is easier to heat and cool down than soil. Snow cover would make soil temps change less because it is insulated by the snow. I personally don’t believe there is any snow cover in these areas because the soil temperatures are not all the same throughout the day; if there was snow cover the temperature line would be straight and with the data I have collected, the lines are not straight for the entire day.
As for the wind speed, Hudson’s wind speed is all over the place and dramatically drops twice. This could correlate to the “storm” we just had this previous Sunday because there is instability in the atmosphere. When the wind speed is as up and down as Hudson’s is, you can probably expect some sort of weather event such as a snow storm or thunderstorm. However, in Stephenson and Hawks the wind is more gradual and less varying, so you could expect more stable conditions. This could correlate to the big storm we had in December and the one over spring break. Finally, all of the locations wind speeds are all over the place and very unstable. I speculate that maybe a low pressure system was in the area, making the atmosphere unstable and the winds crazy.

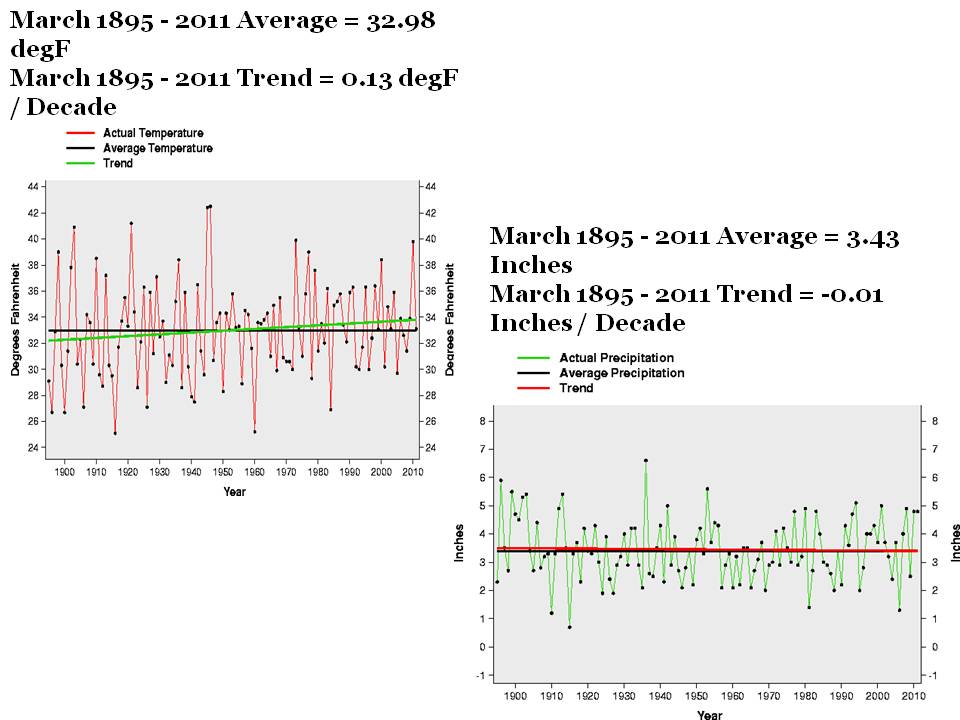
The graphs below show the temperature data trend from March 1895-2011. We can see that
The temperatures from 1895-now have steadily increased and have rarely corresponded with the trend or average temperatures. Precipitation inches are also all over the place and rarely follow the trend or average precipitation. The data shows that there must be a warmer climate because the 2 of the warmest years occurred within the past 10 years, whereas the coldest years have not happened since 1984. This shows that we can expect possibly warmer years overall instead of colder years. Other forms of data to look for climate changes could include overall water content, whether the oceans are getting more water; glacial mass changes, and also soil temperatures.
~~~~~~~~~~~~~~~~~~~~~~~~~~~~~~~~~~~~~~~~~~~~~~~~~~~~~~~~~~~~~~~~~~~~~~~~~
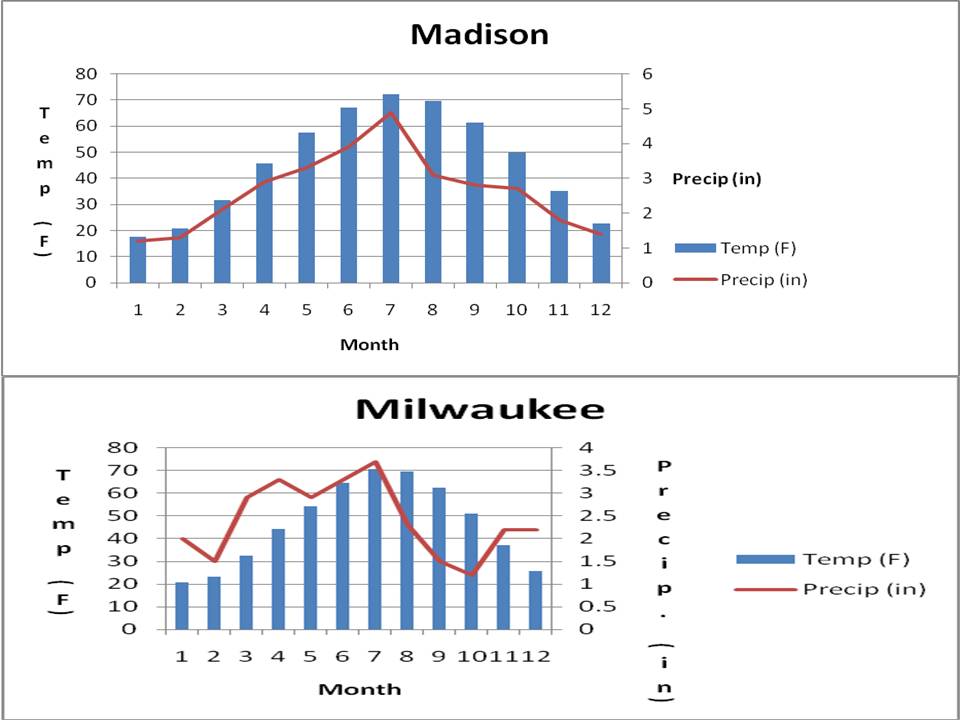
These next graphs analyze the average temperature, RH% A.M., RH% P.M., extreme temp days - below 32, extreme temp days - above 90, rainfall in inches, clear days, partly cloudy days, and cloudy days for both Madison and Milwaukee areas. As shown in the graphs, the data is extremely similar, which makes sense because they are very close in location.


Madison:
Average Temp Min: January – 16.0
Average Temp Max: July – 71.0
RH% A.M./P.M. Min: Jan-79%/May-56%
RH%A.M./P.M. Max: Sept -91%/Dec-73%
Extreme Temp Days below 32 Min: July/Aug:0
Extreme Temp Days below 32 Max: Jan - 30
Extreme Temp Days above 90 Min: Nov-March: 0
Extreme Temp Days above 90 Max: July: 5
Rain Min: Jan/Feb: 1.1
Rain Max: Aug: 4.0
Clear Skies Min: Nov – 5 days
Clear Skies Max: July-October: 9 days
Partly Cloudy Min: Nov-Feb: 6 days
Partly Cloudy Max: July: 11 days
Cloudy Min: July: 11 days
Cloudy Max: Dec: 19 days
Milwaukee:
Average Temp Min: 18.9 Jan
Average Temp Max: 70.9 July
RH% A.M./P.M. Min: 76 Jan/ 61 May
RH%A.M./P.M. Max: 86 Aug/ 72 Dec
Extreme Temp Days below 32 Min: 0 June-Aug
Extreme Temp Days below 32 Max: 29 days Jan
Extreme Temp Days above 90 Min: 0 days October-March
Extreme Temp Days above 90 Max: 4 days - July
Rain Min: 1.5 Feb
Rain Max: 3.5 July/August
Clear Skies Min: 5 days Nov
Clear Skies Max: 10 days July/August
Partly Cloudy Min: 6 days Nov-Feb
Partly Cloudy Max: 11 July/August
Cloudy Min: 10 July/August
Cloudy Max: 18 January
~~~~~~~~~~~~~~~~~~~~~~~~~~~~~~~~~~~~~~~~~~~~~~~~~~~~~~~~~~~~~~~~~~~~~~~~~
The climographs below show the trends with temperature and precipitation for Eau Claire, Minneapolis, Wausau, Madison, Milwaukee, and Superior. It is useful to compare data to more than one location because then we can see the overall trends in Wisconsin and figure out possibly why different regions have different data. Some variables that may influence the differences in data include geographical features (lakes, rivers, mountains, elevation, etc). For example, in EC we have the Chippewa River which affects our data differently than in a location without a river running through it. These data may vary from the data regarding data collection techniques because different stations may use different data measuring techniques for precipitation. For example, one station may use soil wetness techniques, whereas another station may use a cup like structure to collect rain measurements.


~~~~~~~~~~~~~~~~~~~~~~~~~~~~~~~~~~~~~~~~~~~~~~~~~~~~~~~~~~~~~~~~~~~~~~~~~
The graphs below show the mean temperature, maximum temperature, and minimum temperature from January 2011 to April 2011. We can see that January, February, and March fluctuate in temperature considerably throughout the month, whereas April is much more consistent with the temperatures.


~~~~~~~~~~~~~~~~~~~~~~~~~~~~~~~~~~~~~~~~~~~~~~~~~~~~~~~~~~~~~~~~~~~~~~~~~~
These graphs below shows the precipitation data for each month. Temperatures in January and February are mainly below freezing (32 degrees F), whereas March and April are above 0 degrees. This makes sense because temperatures are too low for rain, whereas the temps are higher in March and April resulting in more rain.

Finally, these pie charts show the wind directions for each day in January-April. We see that
The dominant wind direction is W for most of the months, which makes sense since weather moves from the W to the E. The wind direction correlates with precipitation in March and April. There were more E/ESE/SE winds than in January and February. Those wind directions correlate with precipitation with the correct cloud type. March also had numerous days with these wind directions, which makes sense because March also had numerous days with rainfall/precipitation.
